Profiling in Go
Hello, colleagues! Today I'd like to explore quite an interesting topic: profiling. From my experience, not many developers understand what it's for and what problems it helps to solve. So, I decided to shed some light on this. Get comfortable, grab a cup of tea. Let's begin!
Introduction
Profiling — is a process of analyzing a program to determine how it uses resources during execution.
This is a powerful tool for analyzing and optimizing Go program performance. It allows developers to identify bottlenecks, memory leaks, and inefficient code segments, which can significantly improve performance.
In this article, we'll look at the main profiling tools in Go, learn how to use them, and analyze real examples of code optimization. We'll focus on built-in Go tools like pprof, and explore different types of profiling:
- CPU Usage: which functions take up the most processor time? Where does the program spend most of its time?
- Memory Usage (Heap): which parts of code are responsible for the most memory allocation? Where are memory leaks occurring (if any)?
- Blocking and Concurrency (Goroutines, Mutexes): how many goroutines are active? Where are they blocking (e.g., waiting for mutexes or channels)? How long do these blocks last?
- Other Resources: sometimes I/O usage, OS thread creation, etc. are profiled.
Whether you're developing a high-load web service or optimizing a command-line utility, understanding profiling will help you create more efficient Go programs.
Why is Profiling Needed?
- Performance Optimization: find and fix code that runs slowly or inefficiently.
- Resource Usage Reduction: reduce CPU and memory usage, which is especially important for cloud environments and high-load systems.
- Bug Detection and Fixing: find memory leaks, concurrency issues (deadlocks, excessive blocking).
- Program Behavior Understanding: gain deeper insight into how code works under load.
Profiling in Go: pprof
Go has excellent built-in profiling support through the runtime/pprof package and the go tool pprof command-line tool.
Profile Types
- CPU Profile - shows where the program spends CPU time. Works by periodically (by default 100 times per second) taking stack traces of all active goroutines.
- Heap Profile (Memory Profile) - shows which parts of code are responsible for memory allocation that is currently in the heap. You can also get information about all allocations over a period.
- Goroutine Profile - shows stack traces of all current goroutines. Useful for diagnosing hanging goroutines or excessive quantities.
- Block Profile - shows places where goroutines were blocked, waiting for synchronization (channels, mutexes).
- Mutex Profile - shows places where mutexes caused the most contention.
- Threadcreate Profile - shows places in code that lead to creation of new operating system threads.
Collecting Profile Data
There are several ways to collect profile data:
- Through Testing and Benchmarks:
- Running tests with flags:
go test -cpuprofile cpu.prof -memprofile mem.prof -bench .- This will create
cpu.profandmem.proffiles in the current directory.
- Running tests with flags:
- Through HTTP Endpoint (for long-running services):
- Import the
net/http/pprofpackage:import _ "net/http/pprof"
- Start the standard HTTP server (or add
pprofhandler to existing one):go http.ListenAndServe("localhost:8081", nil)
- Profile data will be available at URL:
http://localhost:8081/debug/pprof/
- For example, CPU profile for 30 seconds:
curl -o cpu.prof http://localhost:8081/debug/pprof/profile?seconds=30
- Heap profile:
curl -o mem.prof http://localhost:8081/debug/pprof/heap
- Import the
- Manually from Code (for specific sections):
- Functions from
runtime/pprofpackage, such as:pprof.StartCPUProfilepprof.StopCPUProfilepprof.WriteHeapProfile
- Functions from
Analyzing Profile Data with go tool pprof
After obtaining a profile file (e.g., cpu.prof), analyze it using go tool pprof:
# for profile obtained from benchmarks/tests
go tool pprof {path_to_binary} cpu.prof

# for profile obtained from HTTP
go tool pprof cpu.prof

# for "live" analysis via HTTP
go tool pprof http://localhost:8081/debug/pprof/profile?seconds=30
go tool pprof http://localhost:8081/debug/pprof/heap
pprof opens an interactive console with commands:
topN- show top N functions by resource usage (CPU time, allocated memory).list <regex>- show source code of function matching regular expressionregex, with resource usage annotations.web- generate and open visual call graph in web browser (requires Graphviz installed). This is what you need for visual comparison!peek <regex>- show call stack for function.help- show command help.
For visual analysis, web interface of pprof is often used:
go tool pprof -http=:8082 {path_to_binary} cpu.prof
# or
go tool pprof -http=:8082 http://localhost:8081/debug/pprof/profile?seconds=30
This will start a local web server on port 8082, where you can view different visualizations (Top, Graph, Flame Graph, Source, etc.)
Practice
First, as always, you can find the code for this article on our GitHub:
https://github.com/uagolang/practice
There are many different examples that I try to update from time to time.
Structure
Let's create two examples: one for demonstrating CPU profiling, another for memory. We'll use benchmarks to generate profiles.
fundamental/profiling/
├── cpu/
│   ├── cpu.go
│   └── cpu_test.go
└─── mem/
    ├── mem.go
    └── mem_test.go
CPU Profiling
Let's look at the code in fundamental/profiling/cpu/cpu.go:
package cpu

import "strings"

// inefficient function: string concatenation using '+' in a loop
func concatInefficient(n int, s string) string {
	result := ""
	for i := 0; i < n; i++ {
		result += s // each iteration creates a new string and copies data
	}

	return result
}

// efficient function: using strings.Builder
func concatEfficient(n int, s string) string {
	var builder strings.Builder

	// estimate required size to avoid reallocation
	builder.Grow(n * len(s))
	for i := 0; i < n; i++ {
		builder.WriteString(s) // adding to buffer without extra allocations
	}

	return builder.String()
}
String concatenation is a very basic but quite common (and illustrative) mistake among programmers. Go developers should know that regular concatenation using + copies data and performs allocation, which is very inefficient when dealing with large amounts of data that need to be concatenated. Let's look at some simple benchmarks of these functions:
package cpu

import "testing"

const (
	iterations = 1000
	testString = "abc"
)

func BenchmarkConcatInefficient(b *testing.B) {
	for i := 0; i < b.N; i++ {
		concatInefficient(iterations, testString)
	}
}

func BenchmarkConcatEfficient(b *testing.B) {
	for i := 0; i < b.N; i++ {
		concatEfficient(iterations, testString)
	}
}
Let's run them using go test with the appropriate flags:
go test -bench=. -benchmem -cpuprofile cpu.prof

# -bench=.            : run all benchmarks
# -benchmem           : show memory allocation statistics
# -cpuprofile cpu.prof: save CPU profile to cpu.prof file
Now let's look at the execution results:
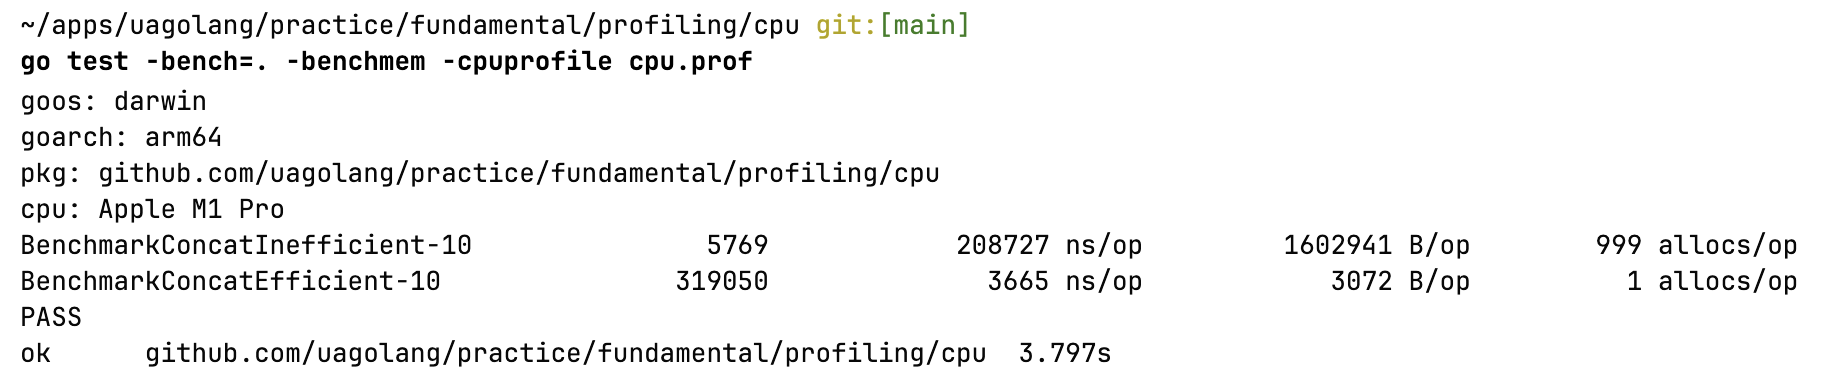
Benchmark results
Shocking, isn't it? 😄 One allocation versus 999! The execution speed differs by orders of magnitude! But it's still not very visual. Hard to grasp, right? So let's add some visualization!
Let's execute a few commands:
# need to specify the test binary file that go test creates temporarily
# easiest way to find its name is in `go test` output or create it explicitly
go test -c -o cpu.test # compile test into binary file
go tool pprof -http=:8085 cpu.test cpu.prof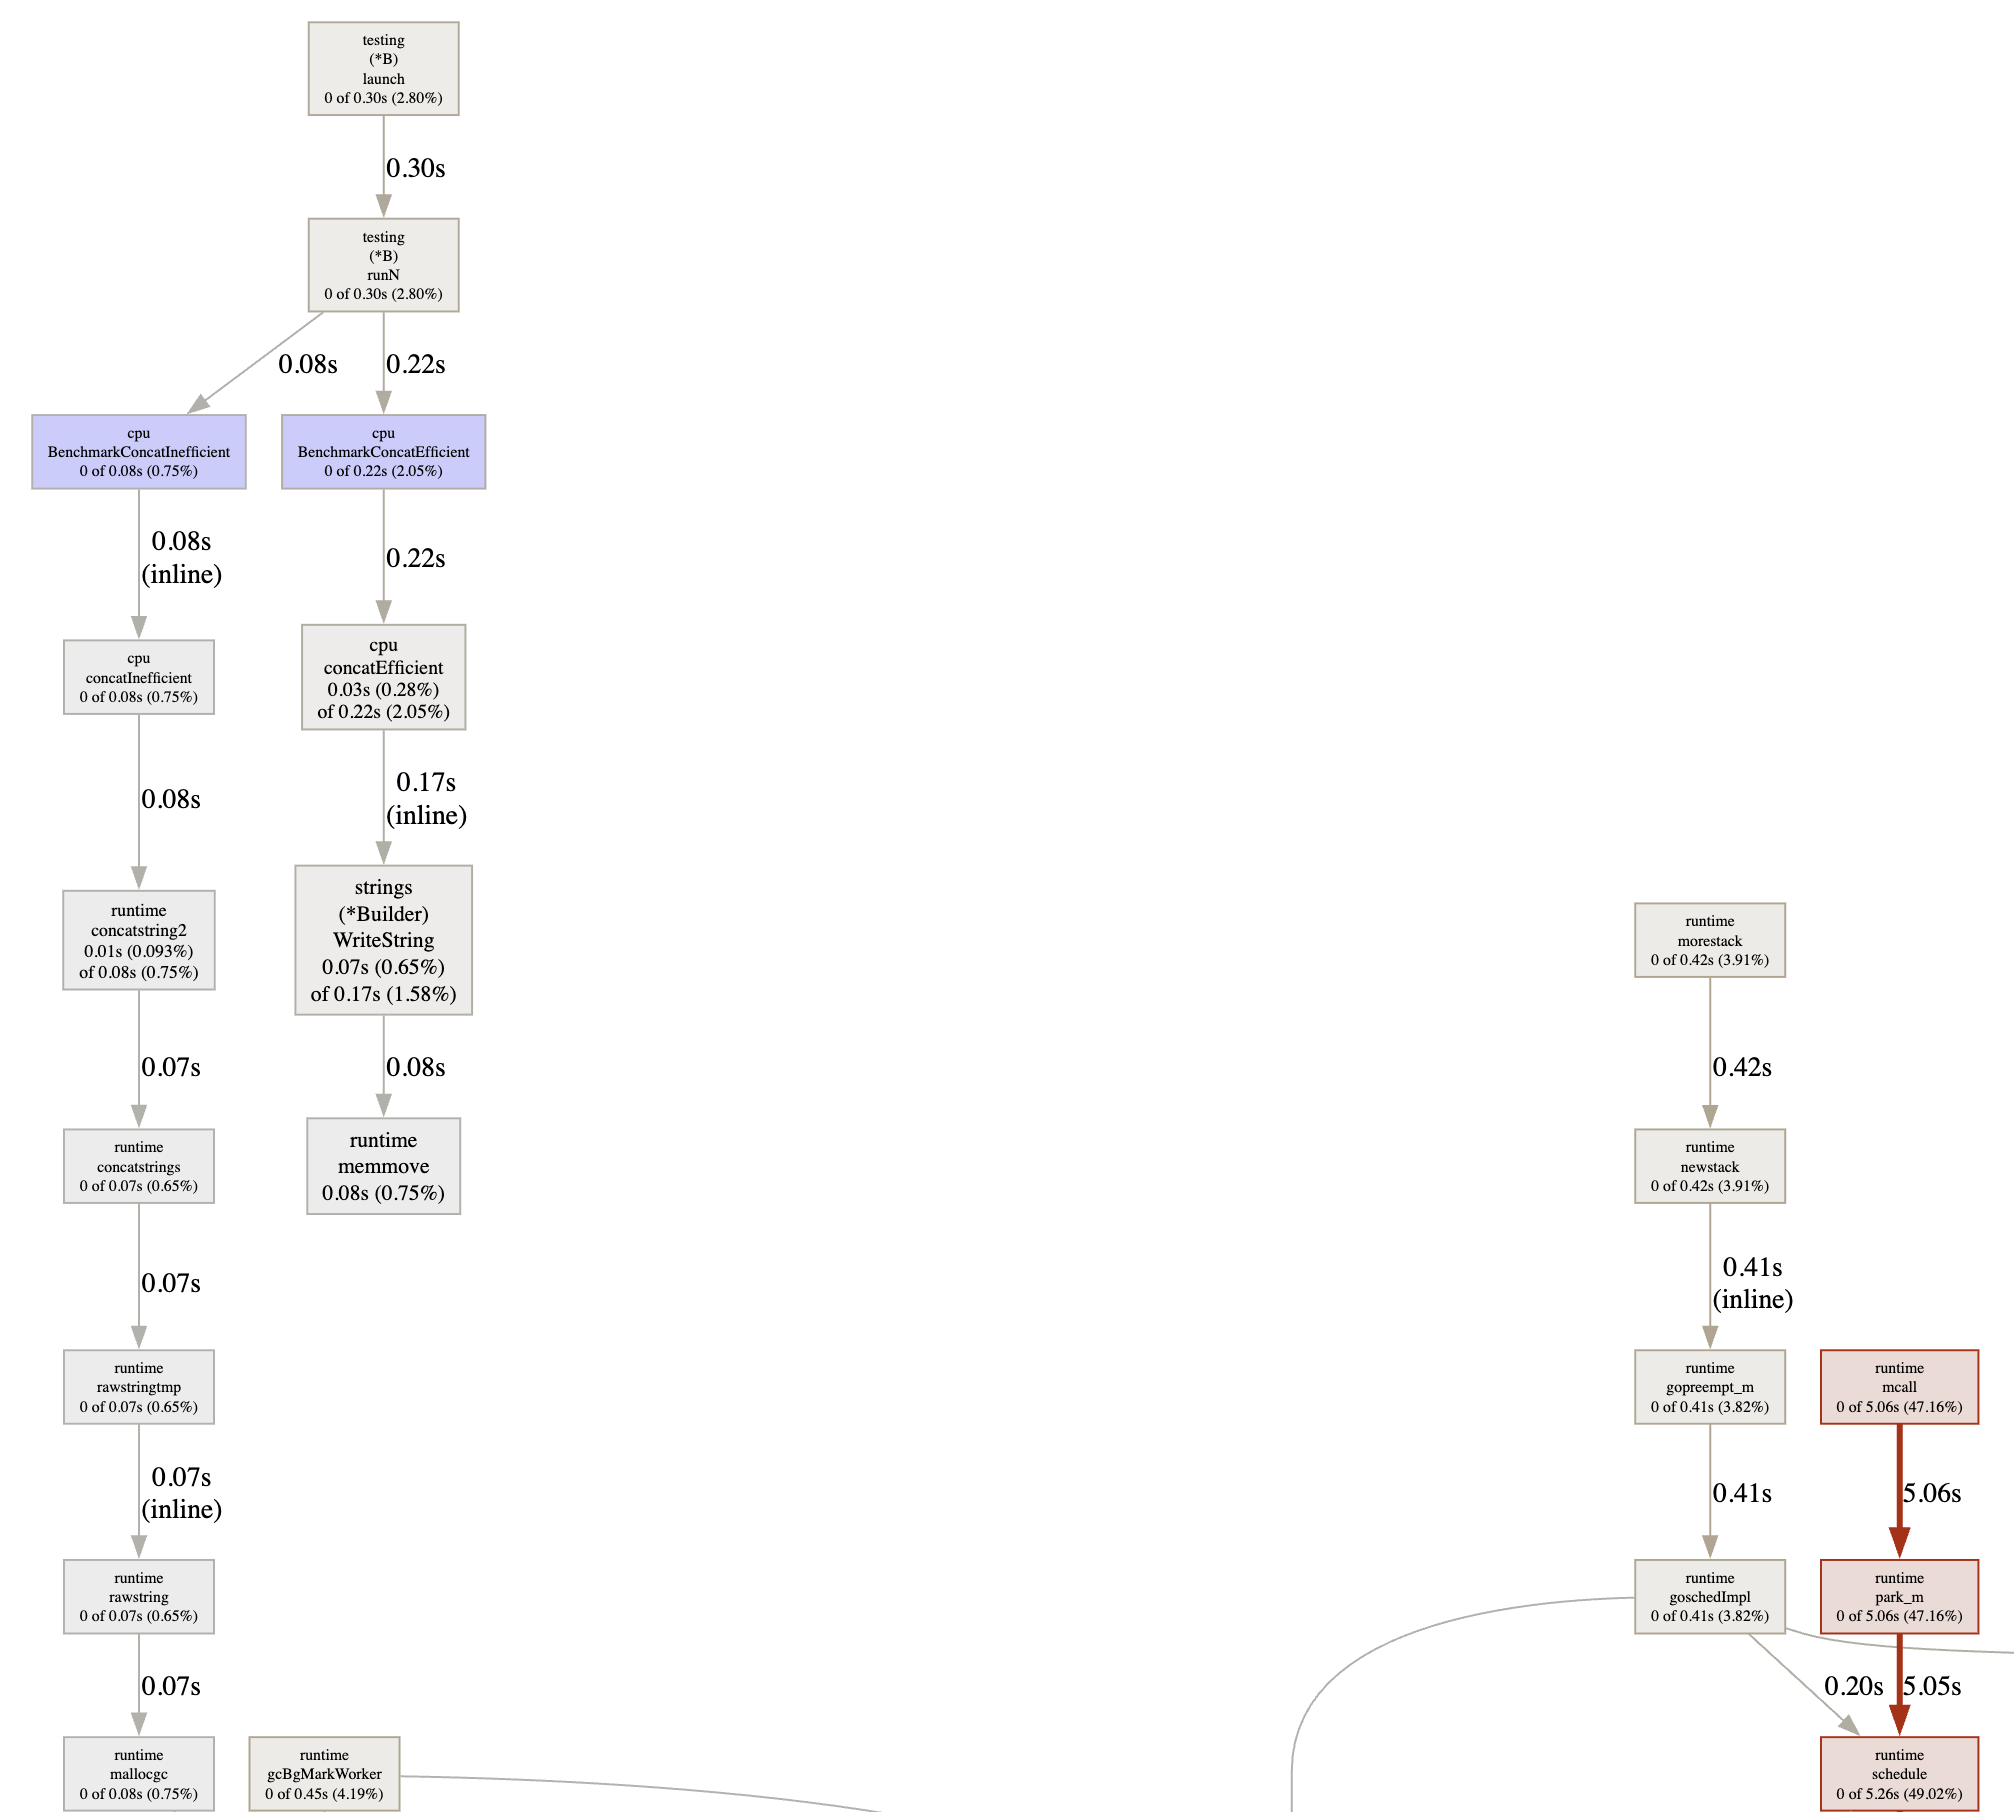
Opened webpage when go tool pprof done
The purple squares are entry points to different functions (efficient and inefficient). The efficient function has a very short callstack since only 1 allocation occurs. If you run it yourself and look at the full graph, you'll see that the number of allocations significantly increases the callstack and consumes a lot of CPU for inefficient allocation work:
- Go to the Graph tab to see the call graph. Find the
concatInefficientfunction. You'll notice that a significant amount of time is spent insideruntimefunctions related to string concatenation (runtime.concatstrings,runtime.mallocgc, etc.). - Now compare it with
concatEfficient. It will take significantly less time, and the call graph will be simpler, with less time spent inruntimefunctions.
Heap (Memory) Profiling
Let's look at the code in fundamental/profiling/mem/mem.go:
package mem

import (
	"fmt"
	"math/rand"
)

// Data - a structure that takes up some memory
type Data struct {
	ID   int
	Name string
	Tags [10]string // add an array to increase size
}

func (d Data) String() string {
	return fmt.Sprintf("id: %d, name: %s, tags: %v", d.ID, d.Name, d.Tags)
}

// inefficient function: creates many temporary objects and slices
func processDataInefficient(count int) [][]byte {
	var result [][]byte // will store serialized data

	// simulation of data generation
	allData := make([]*Data, count)
	for i := 0; i < count; i++ {
		tags := [10]string{}
		for j := 0; j < 10; j++ {
			tags[j] = fmt.Sprintf("tag-%d-%d", i, rand.Intn(1000))
		}
		allData[i] = &Data{
			ID:   i,
			Name: fmt.Sprintf("Name-%d", i),
			Tags: tags,
		}
	}

	// inefficient processing: creating a new string for each field during "serialization"
	for _, d := range allData {
		// simulation of simple "serialization" to []byte via formatted string
		result = append(result, []byte(d.String())) // each append may reallocate result
	}

	// many temporary strings created by fmt.Sprintf
	// allData still exists, taking up memory until the end of the function
	return result
}

// efficient function: buffer reuse and avoiding unnecessary allocations
func processDataEfficient(count int) [][]byte {
	var result [][]byte
	if count > 0 {
		result = make([][]byte, 0, count) // pre-allocate result slice capacity
	}

	var buffer []byte

	// simulation of generation and processing in a single loop
	for i := 0; i < count; i++ {
		tags := [10]string{}
		for j := 0; j < 10; j++ {
			// assume tags are generated on the fly if possible
			tags[j] = fmt.Sprintf("tag-%d-%d", i, rand.Intn(1000))
		}

		// can create on stack (not pointer) if pointer isn't needed outside the loop
		data := Data{
			ID:   i,
			Name: fmt.Sprintf("Name-%d", i),
			Tags: tags,
		}

		// "serialization" with buffer reuse (very simplified)
		// in reality, there would be more efficient logic here (json.Marshal, protobuf, etc.)
		// or manual byte slice formation
		buffer = buffer[:0] // clear buffer (preserving capacity)
		buffer = append(buffer, []byte(data.String())...)

		// need to copy data from buffer since buffer is reused
		dataCopy := make([]byte, len(buffer))
		copy(dataCopy, buffer)
		result = append(result, dataCopy)
	}

	// in this version, fewer temporary strings
	// allData isn't created separately
	// buffer is reused
	return result
}
Let's look at the benchmarks of these functions:
package mem

import "testing"

const dataCount = 5000

func BenchmarkProcessDataInefficient(b *testing.B) {
	for i := 0; i < b.N; i++ {
		_ = processDataInefficient(dataCount)
	}
}

func BenchmarkProcessDataEfficient(b *testing.B) {
	for i := 0; i < b.N; i++ {
		_ = processDataEfficient(dataCount)
	}
}
Let's run them:
go test -bench=. -benchmem -memprofile mem.prof -memprofilerate=1

# -memprofile mem.prof - save Heap profile to mem.prof file
# -memprofilerate=1 - profile every allocation. This slows down execution
#    but gives the most accurate results for memory analysis
#    for real applications, use the default value
#    or higher (e.g., 4096) to reduce overhead
Now let's look at the execution results:
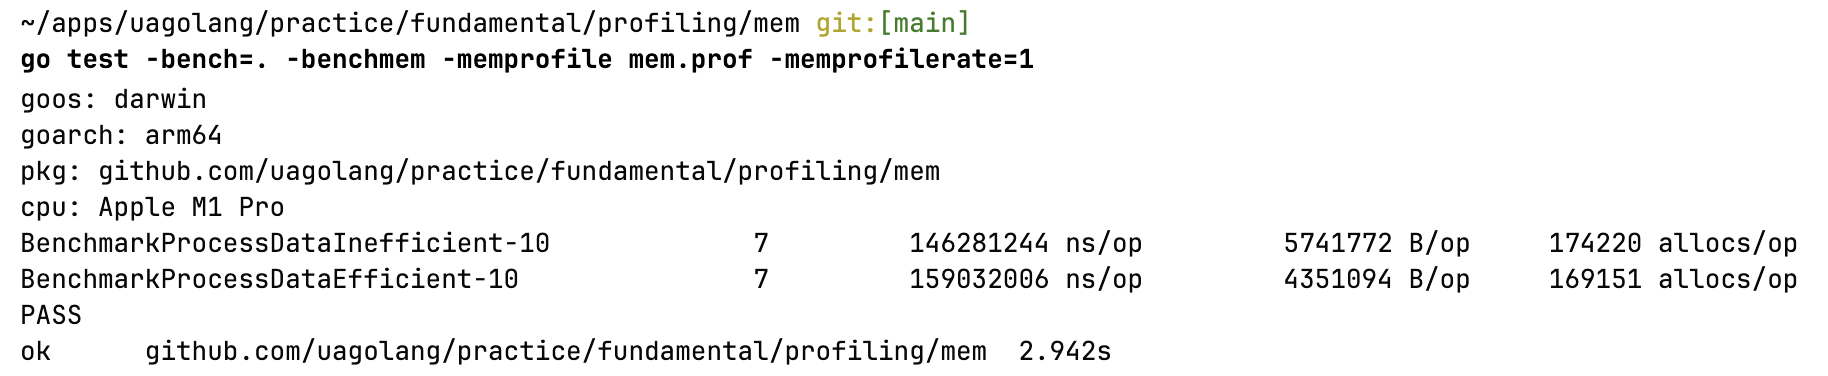
Benchmarks results
As we can see, the difference isn't very large, but it exists and can be crucial in production under load. Let's move on to visualization.
Let's execute a few commands:
go test -c -o mem.test # compile test into binary file
go tool pprof -http=:8086 -sample_index=alloc_space mem.test mem.prof

# -sample_index=alloc_space - shows total allocated memory
# (not just what's currently in heap)
# other indices: inuse_space (memory in heap now), alloc_objects, inuse_objects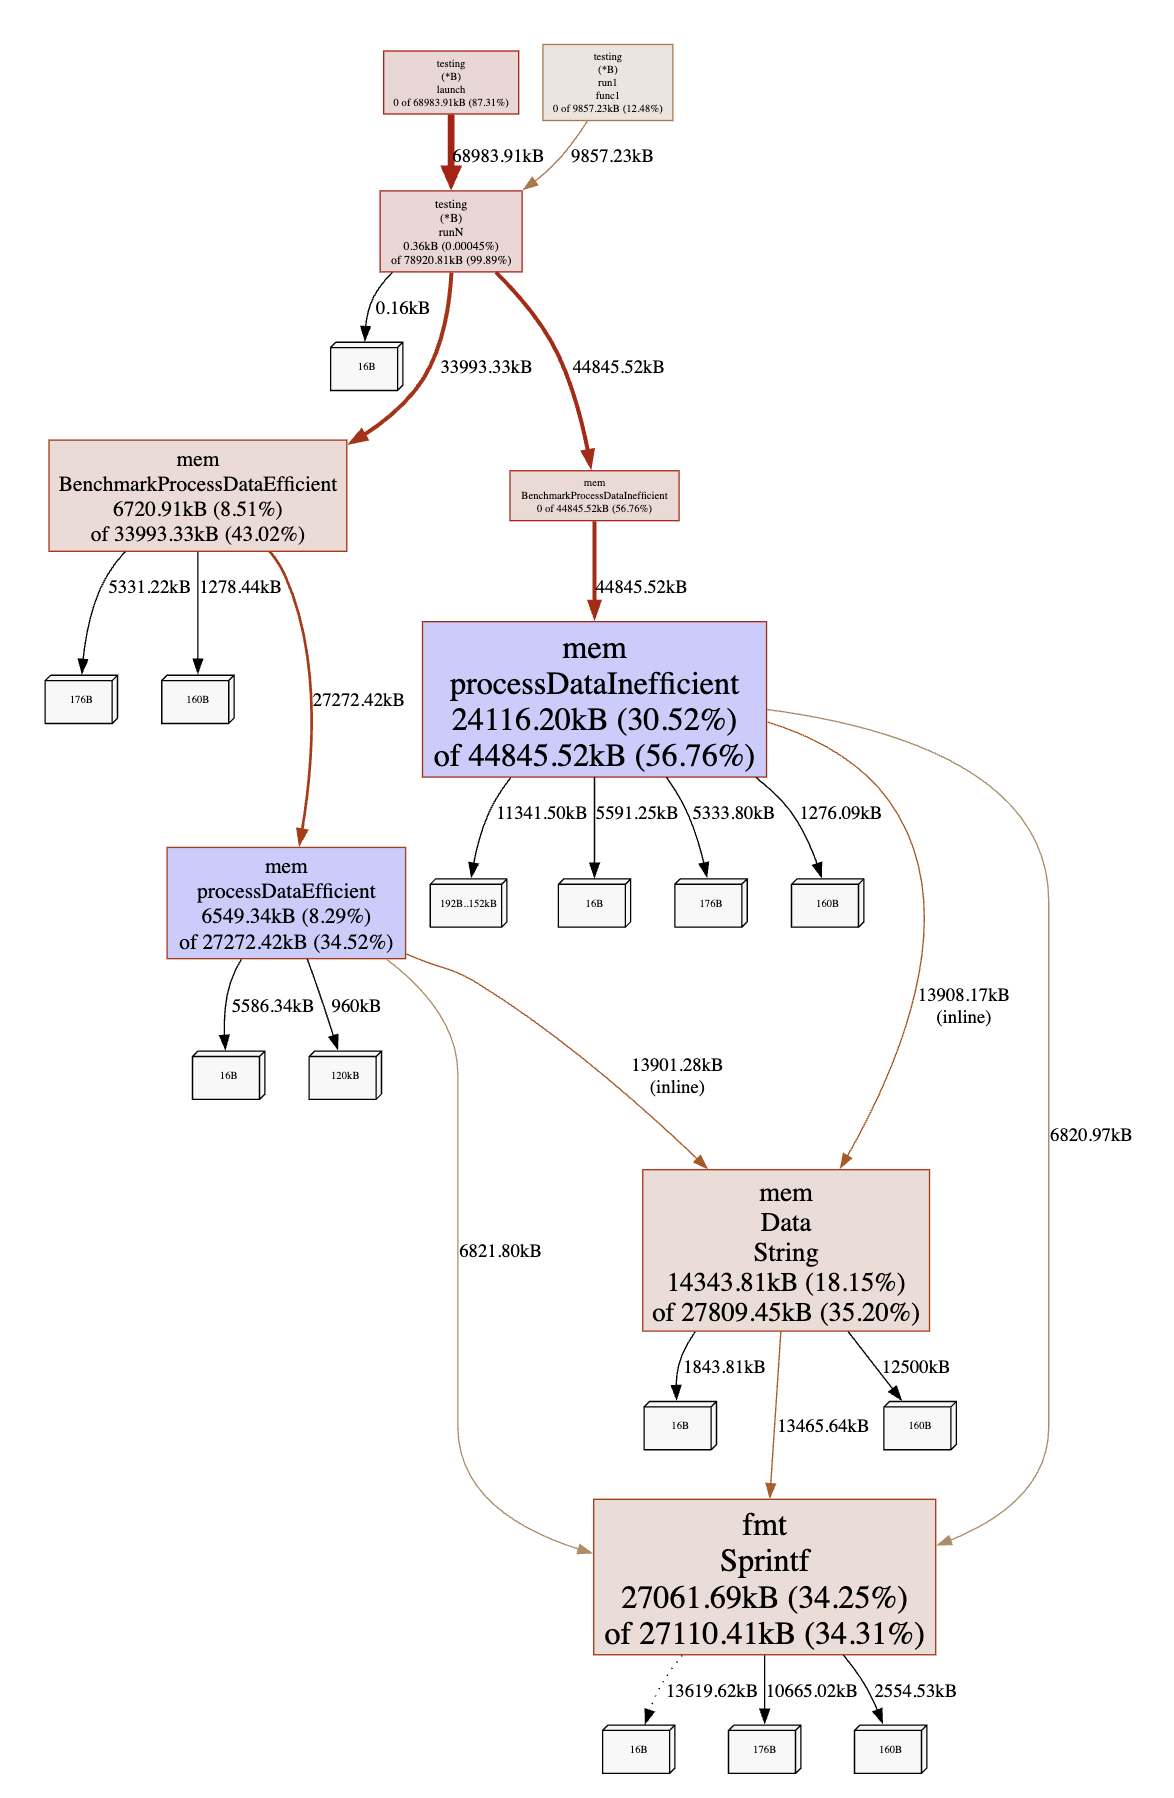
Webpage after run go tool pprof
The image shows memory profiling results as a call graph. Purple rectangles represent different functions, and their size is proportional to the amount of memory they use:
- In
processDataInefficientwe see a larger rectangle, indicating higher memory usage. This happens due to:- Creating a large slice
allDatato store all data at once - Constant allocations during
appendtoresultwithout pre-allocating capacity - Creating new strings with each
String()call
- Creating a large slice
- In
processDataEfficientthe rectangle is smaller thanks to optimizations:- Pre-allocation of
resultwith required capacity - Buffer reuse for serialization
- Processing data "on the fly" without storing the entire set in memory
- Pre-allocation of
Due to these optimizations, the second function uses less memory and works more efficiently in terms of memory management.
Visualization in pprof
Let's look at the main ways to visualize profiles in pprof. Personally, I most often use three: Top, Graph, Flame Graph
Top
Key columns:
flat- amount of resource consumed directly by the function itself (not counting time/memory of functions it called). Highflatmeans the function itself does a lot of workflat%- percentage offlatfrom total resource consumption in the profilesum%- cumulative percentage offlatfor current and all previous rows in the listcum(cumulative) - total amount of resource consumed by the function and all functions it called (directly or indirectly). Highcumbut lowflatmeans the function itself is fast but calls other "expensive" functionscum%- percentage ofcumfrom total resource consumptionName- function name
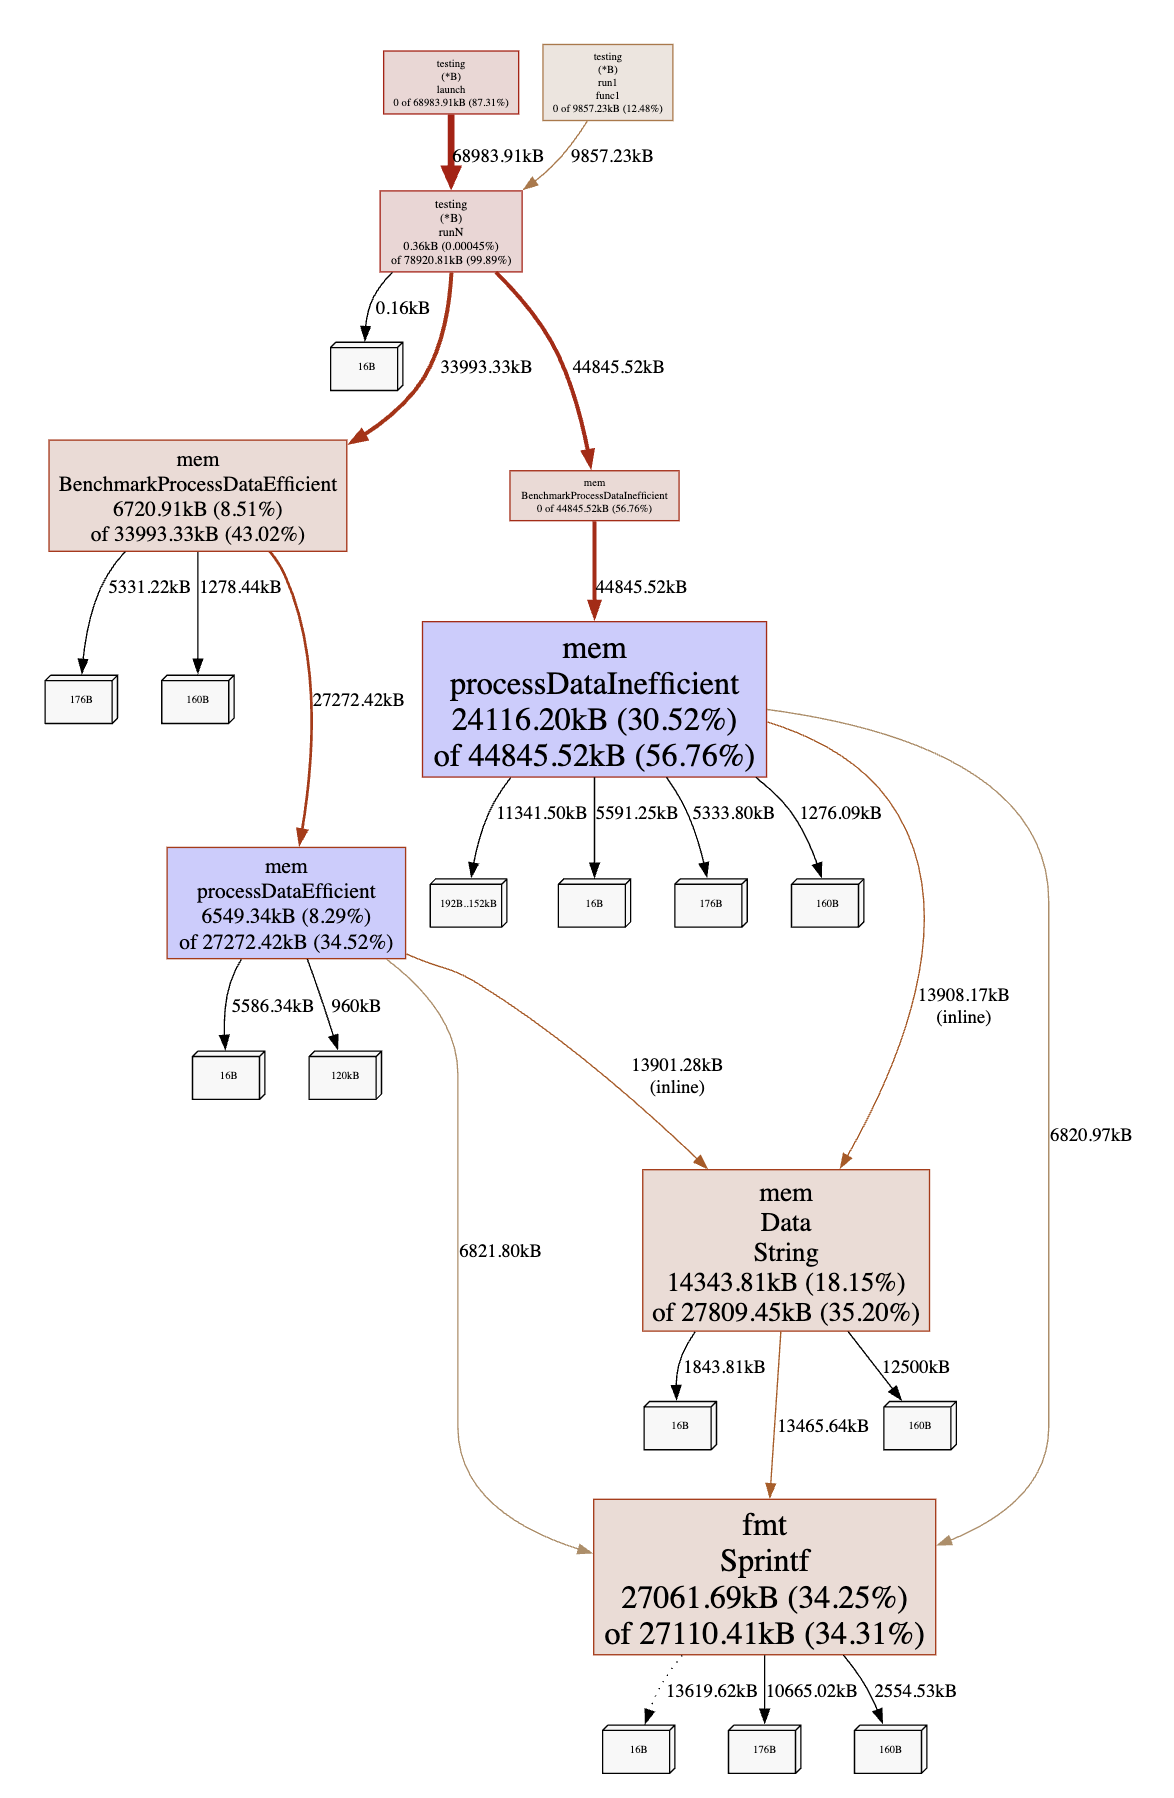
Example Top from the last example (mem)
Graph
How to interpret:
- Nodes - size and/or color of the node usually indicates
flatresource consumption by this function (larger/more intense color = more consumption). The node often showsflatandcumvalues. - Edges - arrows show the direction of calls (from calling to called function). The thickness and/or color of the arrow, and the number next to it, often indicate how much resource was consumed through this call path (i.e., contribution to
cumof the calling function). - Paths - by tracing paths with thick edges and large/intense nodes, you can understand how resource consumption "flows" through the program.
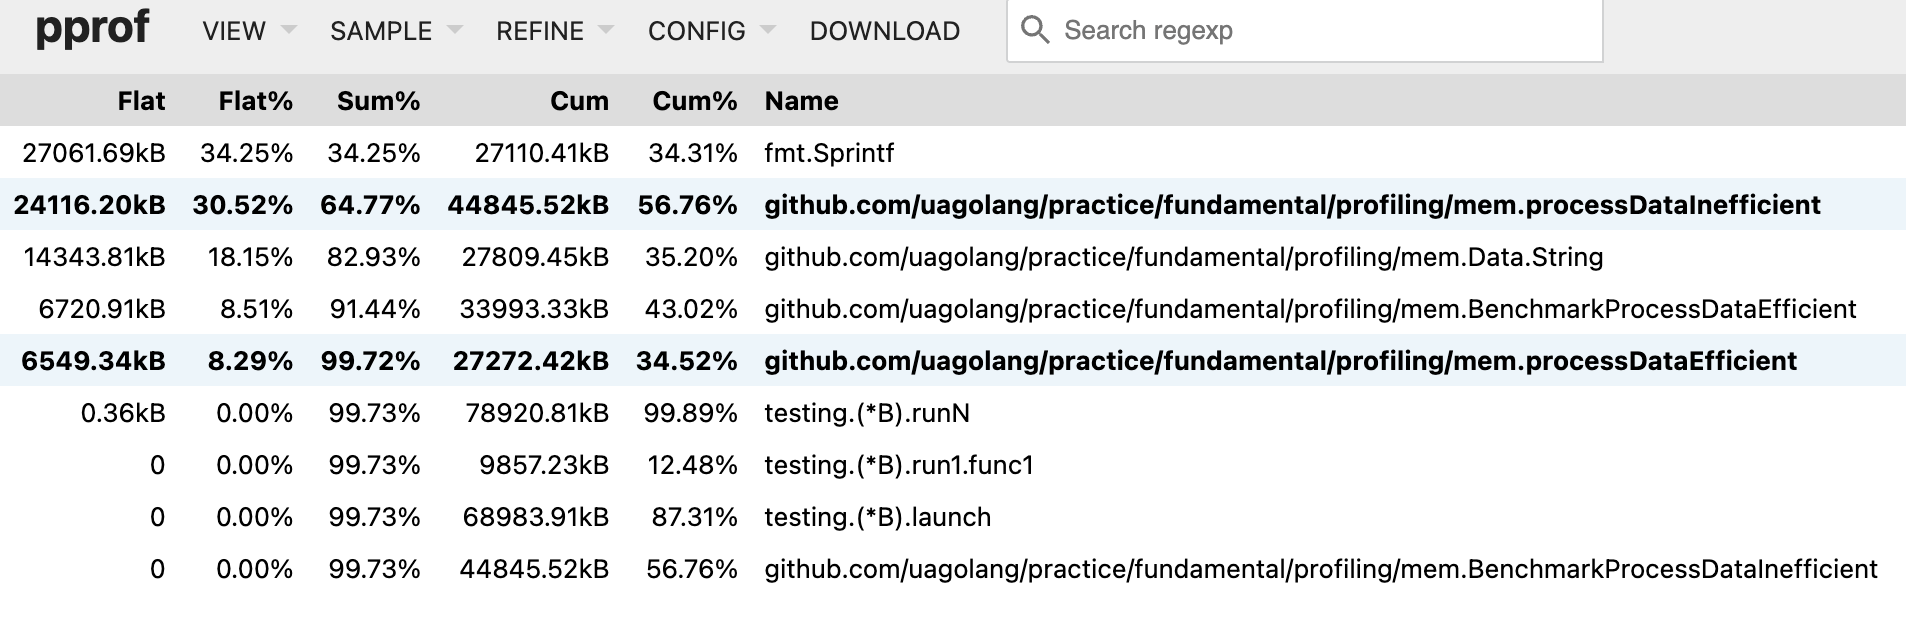
Graph from the last example (mem)
Flame Graph
How to interpret:
- Y-axis (vertical) - call stack depth. At the bottom (
root) are the initial functions (e.g.,mainor goroutine start functions). Above are the functions they call, and so on. Each level represents one step deeper into the stack. - X-axis (horizontal) - total "population" of the sample (e.g., total CPU time). Important: The X-axis does not represent time chronologically. It shows the aggregate of all stacks. The order of blocks at the same level is usually alphabetical and not significant for analysis.
- Rectangles - each rectangle is a stack frame (function call).
- Rectangle width - proportional to the amount of resource consumed by this function and its descendants specifically within those stacks where it appears above its parent rectangle. Wider rectangles indicate more resource consumption in this particular stack context.
- Color - typically used for visual distinction between functions/packages, often random and doesn't carry performance information (unlike heat maps).
- Finding problems - look for wide "plateaus" – rectangles that occupy significant width and are on top of others (or are wide by themselves at their level). This indicates functions where a lot of time/resources were spent directly, or functions that called other expensive functions shown higher in the stack. The wider the "tower" from bottom to top, the more time was spent in that particular call stack.

Flame Graph from the last example (mem)
For better understanding, I've created a table that describes different characteristics of the visualizations covered:
| Characteristic | Top View | Graph View | Flame Graph |
|---|---|---|---|
| What it shows | Sorted list of functions by resource consumption (CPU, memory, etc.) | Graphical representation of functions (nodes) and calls between them (edges) | Hierarchical representation of aggregated call stacks, where width shows proportion of resource consumption |
| How to interpret | Byflat(direct consumption) andcum(including called functions) metrics | By node size/color (flat), edge thickness/color (contribution tocum), call paths | By rectangle width ("plateaus") at different stack levels. Y-axis is stack depth, X-axis is aggregate |
| Best for | Quick identification of leading functions by absolute consumption (flat,cum) | Understanding call structure, analyzing resource consumption paths, visualizing relationships | Quick visual search for "hottest" code paths, understanding proportional stack contribution |
| Advantages | Simple, clearly shows biggest consumers | Clearly shows structure and call context | Intuitive, easy to see proportions, scales well for complex programs |
| Disadvantages | Doesn't show connections and call paths, highcumcontext not obvious | Can be very complex and confusing for large programs, hard to read | Loses explicit view of individual paths (aggregation), X-axis order has no temporal meaning |
| Requirements | None | Installed Graphviz (dot tool) | None |
Conclusion
Let's summarize. Profiling is a powerful tool in a developer's arsenal as it allows detecting issues (with CPU and memory usage, goroutine blocking, data races, etc.) at early stages, provided there is a properly configured monitoring system. Native profiling tools allow both obtaining information in text format and visualizing data using the pprof UI. Lists of expensive operations, visual graphs, and many other possible visualizations of profile data allow for deep analysis of Go software behavior.
Using pprof allows us, developers, to make informed optimization decisions based on real data rather than assumptions. Including profiling in your workflow, especially when you encounter performance issues or unclear resource consumption, will help maintain high quality and efficiency of your Go applications.
Test Yourself
Dear colleagues! How can we improve the characteristics of the last example (mem)? What benchmark results did you get after optimization? I'm looking forward to your responses in the channel comments.